What is Power BI? Uses, Benefits and Cost
What is Power BI? This is the most common question if you are just starting with this solution. You might also be wondering why the most successful businesses use this solution. The answer is straightforward. Power BI lets you analyze and visualize data to make data-driven decisions.
Imagine seeing your complex data sets in the form of a chart, table, and graph and accessing the data in seconds rather than scrolling through an Excel sheet. That is what Microsoft Power BI does.
Business and professionals can create reports using Power BI, access data, and publish comprehensive reports without any prior technical skills. Power BI empowers a novice user with powerful capabilities, such as in-built AI, customization, quick insights, and a data modeling view, so they can create reports from the beginning.
By using Microsoft Power BI software, you can connect various data sources and customize reports according to your business needs. In this blog, we will see everything you need to know about Power BI and its different essential aspects.
Table of Content
What Is Microsoft Power BI?
MS Power BI is a robust business intelligence tool that empowers individuals and organizations to transform raw data into actionable insights. Users can export their data from their existing data source and create immersive and interactive reports in the form of graphs, charts, and tables.
The interactive reports allow you to visualize data, irrespective of their volume, and identify what’s valuable for their organization. With Power BI, a user can uncover hidden trends, identify patterns, and make data-driven decisions.

Benefits of Using Power BI
Making wise decisions is essential to a company's success. Whether you run a small, medium, or large business, Power BI gives you the required control over their business through data visualization and analysis.
Here are few Power BI benefits , including:
Better Ability to Make Decisions
By utilizing AI capabilities, Power BI enables non-technical users to generate reports, automate data analytics, and have access to data insights.
Additionally, the IT and business development teams can collaborate seamlessly thanks to its data modeling engine. It gathers information from multiple sources and assists you in identifying opportunities, enabling you to make informed decisions.
Real-time Data Access
In order to provide a comprehensive data view, Power BI creates seamless connections with a variety of data sources, including Excel files, webpages, databases, and APIs. For companies using on-premises data, the Power BI data gateway ensures secure and up-to-date data connectivity.
Real-time updates to the data source are mirrored on the Power BI dashboard, guaranteeing that your team is always working with the most recent data.
Smooth Integration
Power BI easily integrates with a variety of tools, including D365 Finance and Operations, Microsoft Excel, and Dynamics Business Central. It pulls information from these apps and creates reports using tables, charts, and graphs. This seamless integration, especially with Business Central with Power BI, streamlines reporting processes.
Cost Effectiveness
Businesses can select the Microsoft Power BI license that best suits their needs by selecting from a tiered pricing scheme that includes a free option.
They can select a free option with restricted capability but depending on the scale of the deployment and the number of users, they will have to pay for advanced capabilities. A comparison of Power BI vs Tableau often highlights Power BI's competitive pricing among BI solutions.
An easy-to-use dashboard
Because of its ease of use, the Power BI dashboard has a low learning curve. Even a user with less technical knowledge can customize the data analysis to meet their needs.
You can alter the dashboard to display the data as you see fit. A user is free to act autonomously and access info whenever they want.
Automatic Monthly Updates
Microsoft updates Power BI every month to enhance its features and functionality. They make sure that consumers can access the new features and functionalities by designing with the user in mind.
How to Use Power BI?
Uses of Power BI are straightforward. You can leverage Power BI Desktop or Power BI Service to create your report. Follow these steps and create an interactive report.
- Sign up for a free Power BI account to get started.
- Connect Power BI to your preferred data sources, such as Excel files, databases, and cloud applications. For connecting to on-premises data, remember the Power BI data gateway.
- Use Power Query to clean, shape, and transform your data to meet your analysis needs. This process can be further streamlined using data flows in Power BI for reusable data preparation.
- Build interactive visualizations like charts, graphs, and maps to represent your data effectively.
- Combine multiple visualizations into dashboards to provide a comprehensive overview of your data.
- Publish your report and dashboard to Power BI Service.
- Share your reports and dashboards with colleagues for improved collaboration and decision-making. You can even automate sharing or trigger actions based on your data using Power Automate.
Why Should You Use Power BI Over Other Business Intelligence Tool?
Power BI is a leading name in the business intelligence domain. Many businesses utilize it to analyze data, find errors, and get actionable insights. Here are a few reasons to choose Power BI over others even considering Power BI vs Tableau.
Quick and Simple Data Exploration
Power BI is simple to set up and has a straightforward setup; all you need to do is download, install, and connect to data sources to start gaining insights right away. With its drag-and-drop functionality, you can build reports and charts with just a few clicks and explore the data to identify hidden trends and make data-driven decisions.
Personalize Dashboard to Your Specific Need
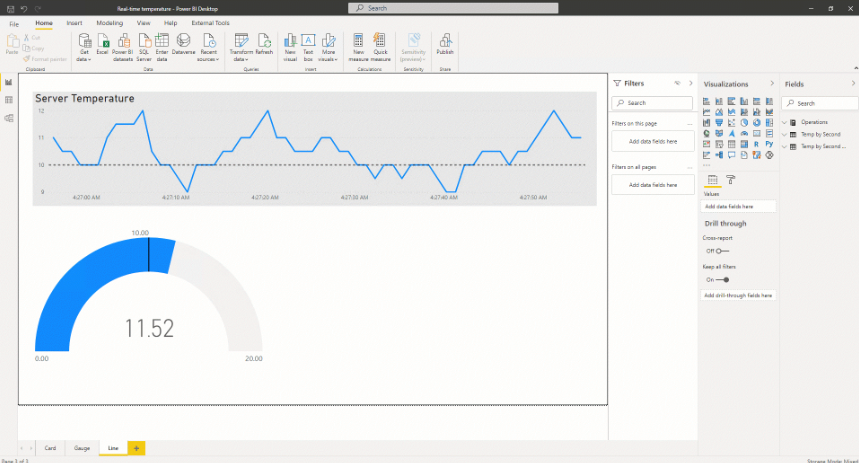
Power BI allows users to customize dashboards with custom visuals, transforming data into actionable insights. You can create heatmaps or variance charts to identify trends, monitor performance, and pinpoint areas for improvement.
With personalized views of the data, users can make faster, data-driven decisions tailored to their specific needs and goals.
.png)
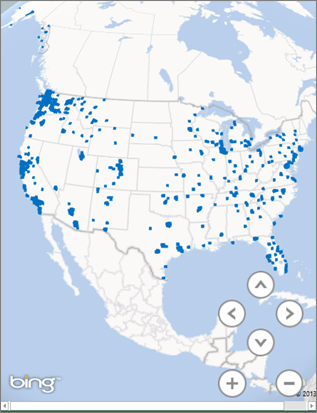
Handle Growing Data with Confidence
Power BI allows users to manage enormous amounts of data with an elevated level of reliability. With enterprise-grade ingestion, Power BI imports large data sets quickly and organizes them for further usage. This allows businesses to handle thousands of data points without any fear of their growth.
.jpg)
Share Reports Easily
Power BI Service enables reports sharing effortless with anyone. Power BI Service makes reports sharing effortless with anyone. This ensures you can collaborate with your team and stay on the same page with automatic dashboard updates after data refresh. Furthermore, you can leverage Power Automate to automate notifications or workflows based on report updates.
Built-in AI Assistant: Copilot
Microsoft’s AI assistant, Copilot, allows users to ask questions to access visuals, find data patterns, avail automation, and create immediate reports. You can ask questions in your own words and uncover hidden insights, identify patterns, and generate reports with ease.
Data Safety
With Microsoft's world-class security capabilities, businesses can ensure their data is protected irrespective of where it is accessed. It also allows you to meet your requirements and mitigate the risks.
Components of Power BI
Microsoft Power BI offers a comprehensive suite of components that cater to various aspects of data analysis and reporting. Let’s know about them:
Power BI Desktop
Power BI Desktop is a free application that includes all the features of the paid version, except for sharing reports and dashboards. A user can create a report by connecting to their multiple data sources after downloading and installing it onto their computer.
You don’t need to purchase any license to build visuals and share the collection of visuals among your team. However, you can publish the report to Power BI Service and share it with anyone after purchasing the license.
.jpg)
Power BI Service
Power BI Service, also known as Power BI Online, is a standard Power BI version that allows you to connect the data and visualize them. It lets you share reports and dashboards with anyone with a standard Power BI license.
Additionally, you can ask questions about data to find the desired information with in-built AI—Microsoft Copilot. Power BI Services also allows users with workspace roles to interact with the report, including editing visuals and applying filters.
.jpg)
Power Query
Power Query allows you to extract data from a wide range of data sources, like text files, social media, and CSV files, apply transformation, and shape the data according to the need.
Power Pivot
Power Pivot is a data modeling and analysis engine designed to handle large datasets. It allows users to work with large data sets, create advanced data models, perform calculations, and establish relationships between data points.
Power View
Power View helps users with data visualization using Power BI and creates interactive reports in various visuals, like charts, graphs, and maps. This ensures users can easily explore and analyze the data. Power View connects to data sources, allows for data filtering, and provides drag-and-drop functionality to visualize the entire report.
Power Map
Power Map allows users to visualize data in 3D and plot the data on the custom map. It offers a unique perspective to users to visualize data based on country, state, city, and other geographic locations.
Power Q&A
Power Q&A allows users to ask questions about data in their words. The in-built Copilot understands the intent behind your question and provides instant answers. To search data, you can speak or type and explore the queries without any data modeling knowledge.
Who Needs Power BI?
Power BI is a valuable tool for anyone who wants to visualize their raw data into actionable insight. Someone who works with vests set of data and needs to make informed decisions can use Power BI, are:
- Data analysts: Professionals who analyze data to uncover insights and make informed decisions.
- Business intelligence analysts: Individuals responsible for designing and implementing business intelligence solutions.
- Data scientists: Data scientists use Power BI to visualize and communicate their findings.
- Executives: Executives use Power BI to gain a better understanding of their business performance and make strategic decisions.
- Small businesses: Small businesses can use Power BI to analyze their data and make data-driven decisions.
- Large enterprises: Large enterprises use Power BI to manage complex data sets and gain insights into their operations.
Get Started with Power BI
To get started with Microsoft Power BI software, you need to follow the following steps. After this, you can find insights and share reports with anyone.
Let’s see each step to get started:
- Create a free Microsoft Fabric account.
- Activate your 60-day free trial to learn how Power BI works.
- Download the Power BI app on your desktop to create faster reports.
- You can read Microsoft documentation to learn more about Power BI.
Moreover, you can schedule a free consultation call with a Microsoft Power BI partner, like Dynamics Square, to reap the best out of the free trial and know “what is Power BI” and “how to get started with ease.”
How Much Does Power BI Cost?
Microsoft Power BI pricing is very straightforward. The Power BI Desktop version is completely free;
however, you need to pay for the two remaining versions: Power BI Pro and Power BI Premium Per User. Here is the detailed price list:
| Power BI License Name | Pricing | Features |
|---|---|---|
| Free account | Free for 60 days | Create reports. Require a Pro or Premium license for report sharing. |
| Power BI Pro | CAD $13.60/user/month | Share the report and publish it for bigger impact. |
| Power BI Premium Per User | CAD $27.10/user/month | All pro features + larger model size access and more frequent refresh |
| Power BI Embedded | Variable | Create reports, analytics, and dashboards in your application. |
Uses of Power BI
Numerous industries are using Power BI to analyze data, create reports, and make data-driven decisions. Here is the list of a few industries that are leveraging Power BI:
Healthcare:

Healthcare organizations often struggle to analyze vast amounts of patient data to identify trends, improve patient outcomes, and ensure compliance with regulations.
By using Power BI, healthcare professionals can track patient demographics, diagnoses, treatments, and outcomes. The use of Power BI empowers professionals to detect patterns in patient data, improving disease prevention and treatment.
For instance, a hospital can use Power BI to identify patients at risk of readmission. This information can be used to implement targeted interventions to improve patient outcomes and reduce costs.
Retail:
.jpg)
Retailers often face challenges in understanding customer behavior, optimizing inventory, and improving marketing campaigns.
Retail businesses can create reports using Power BI to track customer purchases, preferences, and demographics. They can identify product demand, optimize stock levels, and reduce inventory costs. In addition to this, businesses can create a more targeted campaign and provide better customer service.
For example, a retail company can use Power BI to analyze customer purchase data and identify seasonal trends. This information can be used to optimize inventory levels and plan marketing campaigns more effectively.
Manufacturing:
.jpg)
Manufacturing companies often struggle to optimize production processes, reduce costs, and improve quality.
With the use of Power BI dashboards, manufacturing businesses can track production metrics, identify bottlenecks, and improve efficiency. They can analyze cost data to identify areas for cost reduction and track quality metrics.
For instance, a manufacturing company can use Power BI to track cycle time and defect rates. This information can be used to identify bottlenecks and improve production efficiency.
Finance:
.jpg)
Financial institutions often struggle to analyze financial data, forecast revenue, and detect fraud.
With the uses of Power BI, they can track financial metrics, such as revenue, expenses, and profitability, predict future revenue, and identify anomalies in financial data.
For instance, a bank can use Power BI to analyze customer transaction data and detect fraudulent activity. This information can be used to prevent losses and protect customers.
Education:
.jpg)
Educational institutions can track student performance with Power BI reports, which will help school administrators identify the areas for improvement. Moreover, they can also keep track of their inventory using the Power BI dashboard.
Concluding Remarks!
If you have been reading this blog from the beginning, you would have sound knowledge of what Power BI is and how you can utilize it in your unique business. This allows you to transform your complex data into clear insights, uncovering hidden insights and patterns.
You can also share insights among your team members to collaborate effortlessly and make data-driven decisions. However, if you want to know more about Power BI, feel free to reach out to Dynamics Square—your partner in growth.
We are a leading Microsoft Dynamics partner in Vancouver (Canada) with 14+ years of experience in implementing Dynamics 365 and Power Platform solutions to the diverse industries.
With adequate personnel, we ensure the successful implementation capable of revolutionizing your business in existing resources.
For more information, schedule a free consultation call with Microsoft-certified Power BI experts at +1 778 381 5388, or you can draft an email at info@dynamicssquare.ca with a detailed query.
People Also Ask:
What is Power BI used for?
Power BI is used to create reports and dashboards using charts, graphs, and tables. You can connect various data sources to Power BI and visualize them in real-time.
Moreover, you can share reports among your team and other people as well.
Can I use Power BI for free?
Yes, you can use Power BI for free with the desktop version. You can only create reports but can’t share with anyone with the free version.
How do I create a dashboard in Power BI?
- Open the Power BI and connect the data source to import your dataset.
- Once you have the data, start designing the visualization using lines, bars, tables, graphs, and heat maps.
- Arrange the visuals on the dashboard canvas to make the layout meaningful.
- Add titles, images, and text boxes to make your visual more contextual.
- Edit the dashboard if required.
- Save it and publish the dashboard to Power BI Services for sharing purposes.
How to use AI in Power BI?
Power BI comes with in-built AI assistance, Copilot, which is at the left of the screen.
You can click on the Copilot button and ask questions about data in plain language, easily navigate data across multiple dimensions, and summarize them.
What is Power BI Copilot?
Power BI Copilot is an AI-powered assistant that can help you get more out of Power BI. It can help you generate ideas for visualizations, suggest calculations, and even write DAX formulas.
What are Power BI dataflows?
Power BI dataflows are a way to automate the process of extracting, transforming, and loading (ETL) data into Power BI. This can save you time and effort, ensuring that your data is always up to date.
What is a Power BI Query?
Power Query is a tool in Microsoft Power BI that helps users extract, transform, and load data from various sources. It's also known as a self-service ETL tool because it can extract, load, and transform data by itself.
It can perform simple transformations like removing columns or filtering rows, or more advanced transformations like merging, appending, grouping by, pivoting, and unpivoting.
What is DAX in Power BI?
DAX (Data Analysis Expressions) is a formula language that you can use to create custom calculations in Power BI. DAX can be used to perform a wide range of calculations, such as calculating averages, sums, and differences.
How does Power BI ensure data safety and security?
Power BI uses Azure SQL DB and Azure Blob Storage encryption to protect your data. You can also implement additional security measures, such as row-level security and data loss prevention policies.
Can Power BI integrate with all types of data sources?
Power BI can integrate with a wide variety of data sources, including Excel files, databases, cloud applications, and online services. However, some data sources may require additional connectors or configuration.
What are the specific differences between Power BI Desktop and Power BI Service?
Power BI Desktop is a free application that you can use to create and edit reports. Power BI Service is a cloud-based service that allows you to share and collaborate on reports. Power BI Desktop includes all features of Power BI Service, plus some extra features for creating and editing reports. Power BI Service includes features for sharing and collaborating on reports and for managing your Power BI environment.

Arish Siddiqui working with Dynamics Square and helps SMB/Enterprises in USA & Canada to use Dynamics 365 ERP/CRM, Power Platform and other Solutions with full of its capabilities which ultimately cut businesses costs and improve efficiency.